Drivers do not control road budgets, signal timing, lane widths, or bridge inspections. Still, they shape road safety every mile. A driver who slows down near a school, leaves space for cyclists, reports a pothole, and treats driver-assist tech as backup rather than autopilot helps convert a risky corridor into a safer one.
That idea now carries new weight. Honda's roadway maintenance pilot with DriveOhio showed how connected vehicles can detect damaged signs, guardrails, potholes, rough pavement, lane-marking issues, and shoulder drop-offs. The point lands hard: modern vehicles can do more than move people. They can feed agencies the data needed to repair hazards faster.
Safer Roads Start With Driver Behavior
The Safe System approach starts with a blunt premise: people make mistakes, and the human body can only tolerate limited crash forces. That means safer roads need better infrastructure, safer vehicles, survivable speeds, responsible road users, and faster post-crash response.
Drivers control one of those pillars every day.
Core driver actions that reduce crash risk:
- Match speed to the street, weather, visibility, and road users nearby.
- Keep a 3-second following gap in dry conditions and expand it in rain, snow, fog, or darkness.
- Yield early to pedestrians, cyclists, mobility-device users, and motorcycles.
- Report potholes, missing signs, broken signals, faded lane markings, and blocked sight lines.
- Use safety technology as a support layer, not a substitute for attention.
Pro-Tip
Treat every neighborhood street like a mixed-use safety zone. A 20 mph impact gives a pedestrian a far better survival chance than a 40 mph impact because crash energy rises with the square of speed.
Why Speed Management Beats Good Intentions
Speed drives crash severity. A driver can make a small steering or braking error at 20 mph and still leave enough distance, time, and energy margin for recovery. At 45 mph, that same error closes space faster, increases kinetic energy, and gives pedestrians, cyclists, and older road users less time to react.
Looking at the data, the Safe System logic uses human tolerance as the limit. Around 20 mph works better where pedestrians mix with vehicles. Around 30 mph can fit side-impact risk. Around 40 mph can fit head-on crash survivability only when the road design controls conflict and separates traffic.
| Road Context | Safer Target Speed | Main Risk | Driver Action That Helps |
|---|---|---|---|
| School zones, residential streets | 20 mph / 32 km/h | Pedestrian impact trauma | Slow before crossings and parked cars |
| Urban arterials with crossings | 25-30 mph / 40-48 km/h | Side-impact crashes | Watch signal timing and turning gaps |
| Two-way rural roads | 40 mph / 64 km/h where conflicts rise | Head-on crashes, shoulder drop-offs | Stay centered, avoid risky passing |
| High-speed roads | 55-70 mph / 89-113 km/h | Run-off-road crashes, debris, fatigue | Increase spacing and scan shoulders |
Connected Cars Can Turn Daily Driving Into Road Intelligence
Honda, DriveOhio, Parsons, i-Probe, and the University of Cincinnati tested a proactive roadway maintenance system across about 3,000 miles. Vehicle sensors and Edge AI models processed road-condition data, sent it to a Honda cloud platform, and integrated it into a work-order system for maintenance teams.
The pilot reported 99% accuracy for damaged or obstructed signs, 93% accuracy for damaged guardrails, and 89% average accuracy for potholes. It also flagged severe shoulder drop-offs that routine visual inspection can miss. In addition, the project estimated more than $4.5 million in annual savings for the Ohio Department of Transportation through reduced manual inspection time, better maintenance scheduling, and earlier repairs.
| Detected Road Issue | Pilot Result | Why It Matters |
|---|---|---|
| Damaged or obstructed signs | 99% accuracy | Drivers need clear, visible instructions before hazards |
| Damaged guardrails | 93% accuracy | Barriers manage run-off-road crash energy |
| Potholes | 89% average accuracy | Pavement defects can damage tires, wheels, and suspension |
| Shoulder drop-offs | High-severity cases flagged | Drop-offs can trigger loss of control during recovery |
| Lane marking issues | Data supported restriping decisions | Markings guide drivers and driver-assist cameras |
From an expert perspective, this matters because agencies often fix roads after complaints, crashes, or scheduled inspection cycles. Connected-vehicle data can move that model toward condition-based maintenance. Drivers help by reporting hazards today and opting into privacy-protected road-condition data systems as they mature.
Technology Helps, But It Does Not Drive For You
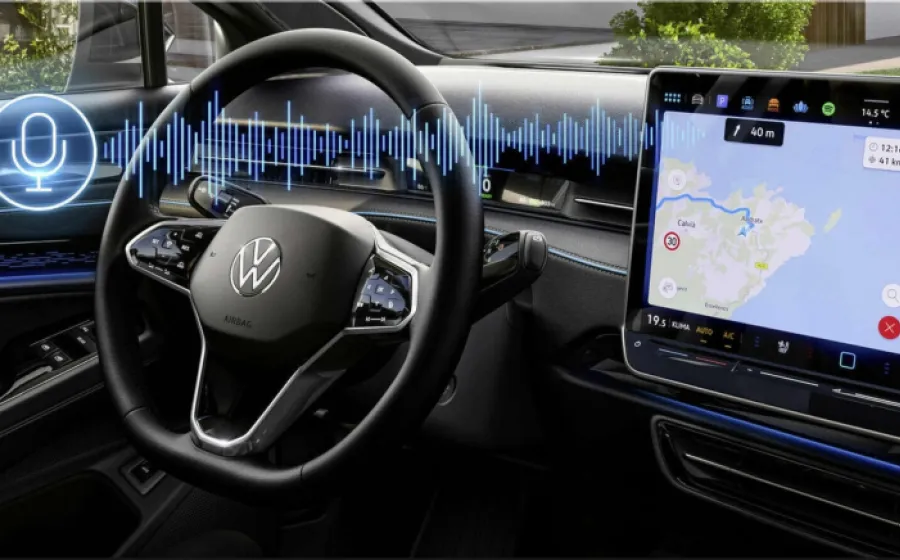
Modern vehicles bring advanced driver assistance systems into daily traffic. Automatic emergency braking, lane-keeping support, blind-spot monitoring, adaptive cruise control, and traffic-sign recognition can reduce certain crash risks. These systems use cameras, radar, ultrasonic sensors, software logic, and brake or steering inputs to warn, assist, or intervene.
But sensors have limits. Faded lane lines, glare, heavy rain, snow, mud, construction zones, worn signs, odd road geometry, and sudden pedestrian movement can reduce performance. Consequently, a driver must stay engaged, hands ready, eyes up, and mind on the task.
Definition: ADAS
Advanced driver assistance systems are vehicle technologies that monitor the driving environment and support braking, steering, speed control, lane positioning, or warning functions. They assist the driver. They do not transfer responsibility away from the driver.
Shared Roads Need Predictable Drivers
Pedestrians, cyclists, motorcyclists, older adults, children, people with disabilities, and transit riders face different risk patterns. A driver who understands that mix makes better choices at intersections, curbside zones, alleys, driveways, and parking lots.
Specifically, cyclists need predictable passing space, clean pavement, and protection from door zones. Pedestrians need visible crossings, slower turning vehicles, and unobstructed sight lines. Motorcyclists need drivers who check mirrors twice because a motorcycle's smaller profile can hide in blind spots or behind pillars.
Driver checklist for shared-road safety:
- Check mirrors and blind spots before every lane change.
- Open doors with the far hand to force a shoulder check.
- Leave at least 3 feet / 0.9 meters when passing cyclists where local law permits.
- Stop before the crosswalk line, not inside the walking path.
- Avoid blocking bike lanes, bus stops, curb ramps, and intersections.
Road Design Works Best When Drivers Read The Cues
Good road design tells drivers what to do before a sign orders it. Engineers call this a self-explaining road. Lane width, markings, lighting, curb radius, medians, surface quality, and roadside friction all shape speed and attention.
By comparison, wide lanes and long straight approaches invite higher speeds. Narrower lanes, curb extensions, raised crosswalks, medians, and roundabouts push drivers toward slower, more controlled movement. The best designs reduce conflict points and lower impact energy before anyone makes a mistake.
| Design Strategy | What It Changes | Driver Benefit | Safety Logic |
|---|---|---|---|
| Raised crosswalk | Lifts crossing to sidewalk grade | Slower approach speed | Pedestrians gain visibility and priority |
| Road diet | Converts 4 lanes into 3 with center turn lane | Fewer lane changes | Left turns leave through lanes |
| Roundabout | Replaces signalized crossing conflicts | Lower-speed flow | Conflict points drop from 32 to 8 |
| Diverging diamond interchange | Moves traffic left at ramp crossings | Safer left turns | Conflict points drop from about 26 to 14 |
| Access management | Controls driveways and intersections | Fewer surprise entries | Conflict spacing improves reaction time |
What Drivers Should Report To Build Safer Roads
Drivers see defects before agencies do. That makes reporting one of the highest-value actions available to the public. A single report may not rebuild a corridor, but repeated reports can reveal a pattern that supports maintenance, enforcement, redesign, or funding.
Report these hazards fast:
- Potholes deeper than 2 inches / 51 mm.
- Shoulder drop-offs near the edge line.
- Missing, twisted, faded, or blocked signs.
- Broken traffic signals or dead pedestrian push buttons.
- Faded lane markings at night or in rain.
- Standing water, blocked drains, gravel, debris, or oil.
- Crosswalks blocked by parked vehicles or overgrown vegetation.
The ROI Of Safer Driving
Safe driving saves time in the only way that counts: it prevents the crash that turns a 20-minute trip into a hospital visit, insurance claim, legal case, or funeral. It also reduces maintenance costs. Hard braking, pothole strikes, curb impacts, and aggressive acceleration wear tires, brakes, wheels, dampers, and suspension bushings faster.
In addition, safer driver behavior improves traffic flow. Smooth acceleration and longer following gaps reduce shockwave braking, which causes stop-and-go traffic even when no crash exists. A driver who leaves room also gives emergency vehicles, buses, delivery trucks, and cyclists space to move without sudden conflict.
What Now?
Start with one practical habit this week: drive 5 mph slower on streets with people walking or biking nearby. Then report one road hazard. Finally, check your vehicle's ADAS settings and owner manual so you know what the system can and can not do.
Safer roads need engineers, automakers, public agencies, enforcement, and policy. But drivers still supply the daily operating system. Every speed choice, mirror check, hazard report, and patient yield adds one more data point in favor of safer streets.
- 83 views